Research Needs
Workshop Series 4
Watershed-based nutrients and nearshore ecosystem behaviour
Lake Erie Land and Water - Clarifying the Urban -
Eutrophication Linkage
LEMN Research Needs Workshop 4.5 B
Thanks to all attending!
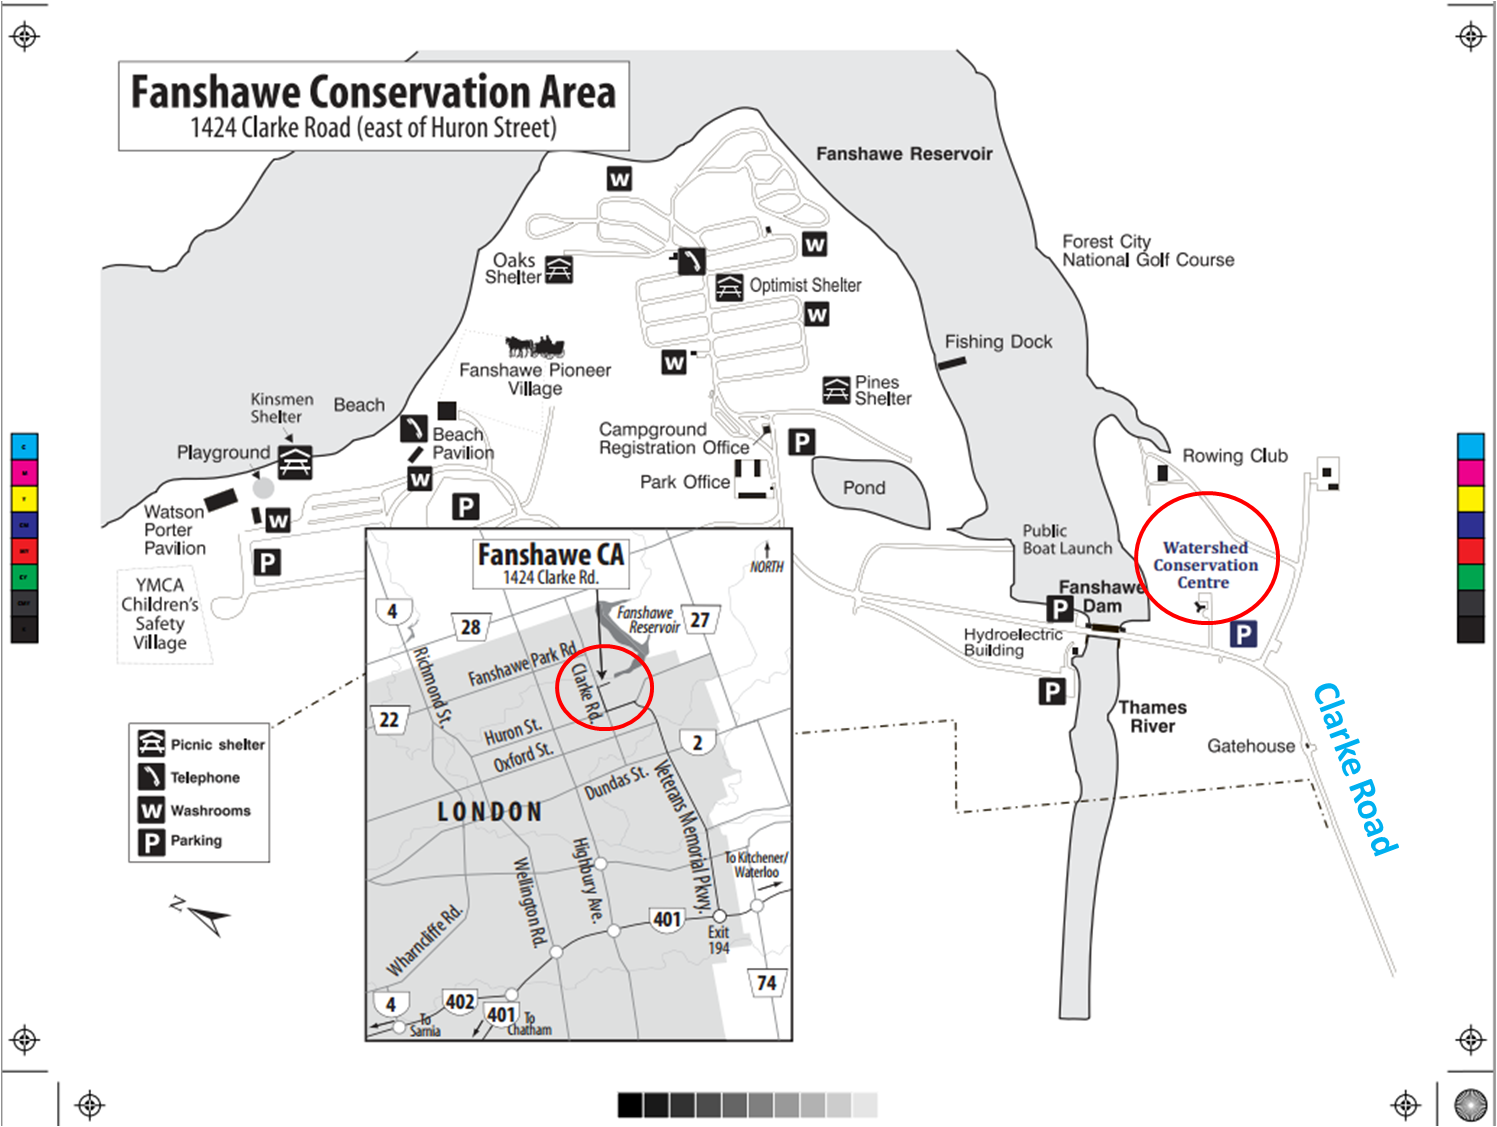
Friday April 25, 2014 – Upper Thames River Conservation
Authority, London, ON
Sponsored by Environment Canada (Lake Erie LAMP) through the Lake Erie
Millennium Network
Please read the detailed
information below but if you have any questions/concerns before the
workshop please contact:
Jesse Gardner Costa
Department of Biological Sciences, University of Windsor,
Tel.: 519-253-3000 ext. 4764
Jan Ciborowski Department of Biological Sciences, University of
Windsor, Tel.: 519-253-3000 ext. 2725
Brad Bass,
Environment Canada
Tel.: 416-648-5387
|
Contents
Urban FCM_List of keywords.xls - prioritize variables
Purpose Statement
Logistics (Time,
Agenda) |
||||||||||||||||||||||||||||||||||||||||
Timeline (subject to change) 1. Sunday April 20 (or sooner) Task: Receive preliminary agenda and request for input (Sunday April 20 or sooner) Receive Doodle request to indicate availability for a conference call 2. Task: Indicate availability for conference call on Tues or Wed Apr 22 or 23 Requested Action Send Doodle reply to Jesse Gardner Costa (gardnee@uwindsor.ca) Action Date: Mon Mar 18 9:00 p.m. 3. Task: Visit Workshop web page Requested Action: Download and review background information (optional) Action Date: Prior to Conference call 4. Task: Participate in 30-min orientation conference call Requested Action: Become familiar with approach to FCM tasks (purpose of the call) Action Date: Tues/Wed Apr 22/23, according to availability 5. Task: Attend Workshop Requested Action (optional): Describe your research interests/ data if you wish (bring 2 PowerPoint slides; 3 min max per person); Action Date: Fri Apr 25 8:45 a.m. 6. Task: Provide post-workshop clarification Requested Action: Help resolve ambiguities in map/ information Action Date: Prior to 5 May 7. Task: . Receive brief summary of workshop findings Requested Action: Provide feedback/criticism editorial suggestions Action Date: Prior to 16 May Web Page: http://web2.uwindsor.ca/lemn/
Provisional Agenda Friday April 25 2014 8:45 Coffee; informal gathering 9:00 Welcome and Introductions 9:15 Introduction to the problem 9:35 Introduction to the exercise 10:00 FCM creation - part I 12:05 Working Lunch; Reporting out & clarification of terms Brief presentations and research interest summaries (5 min each) 1:00 FCM creation part II 4:00 Discussion - key map elements by group
4:40 Discussion
- Developing a consensual map; next steps 5:00 Adjourn
|
||||||||||||||||||||||||||||||||||||||||
|
Presentations- Morning Brad Bass (2013 talk) - Environment Canada Jan Ciborowski (2013 talk) - University of Windsor Presentations- Lunch
|
||||||||||||||||||||||||||||||||||||||||
|
|
||||||||||||||||||||||||||||||||||||||||
|
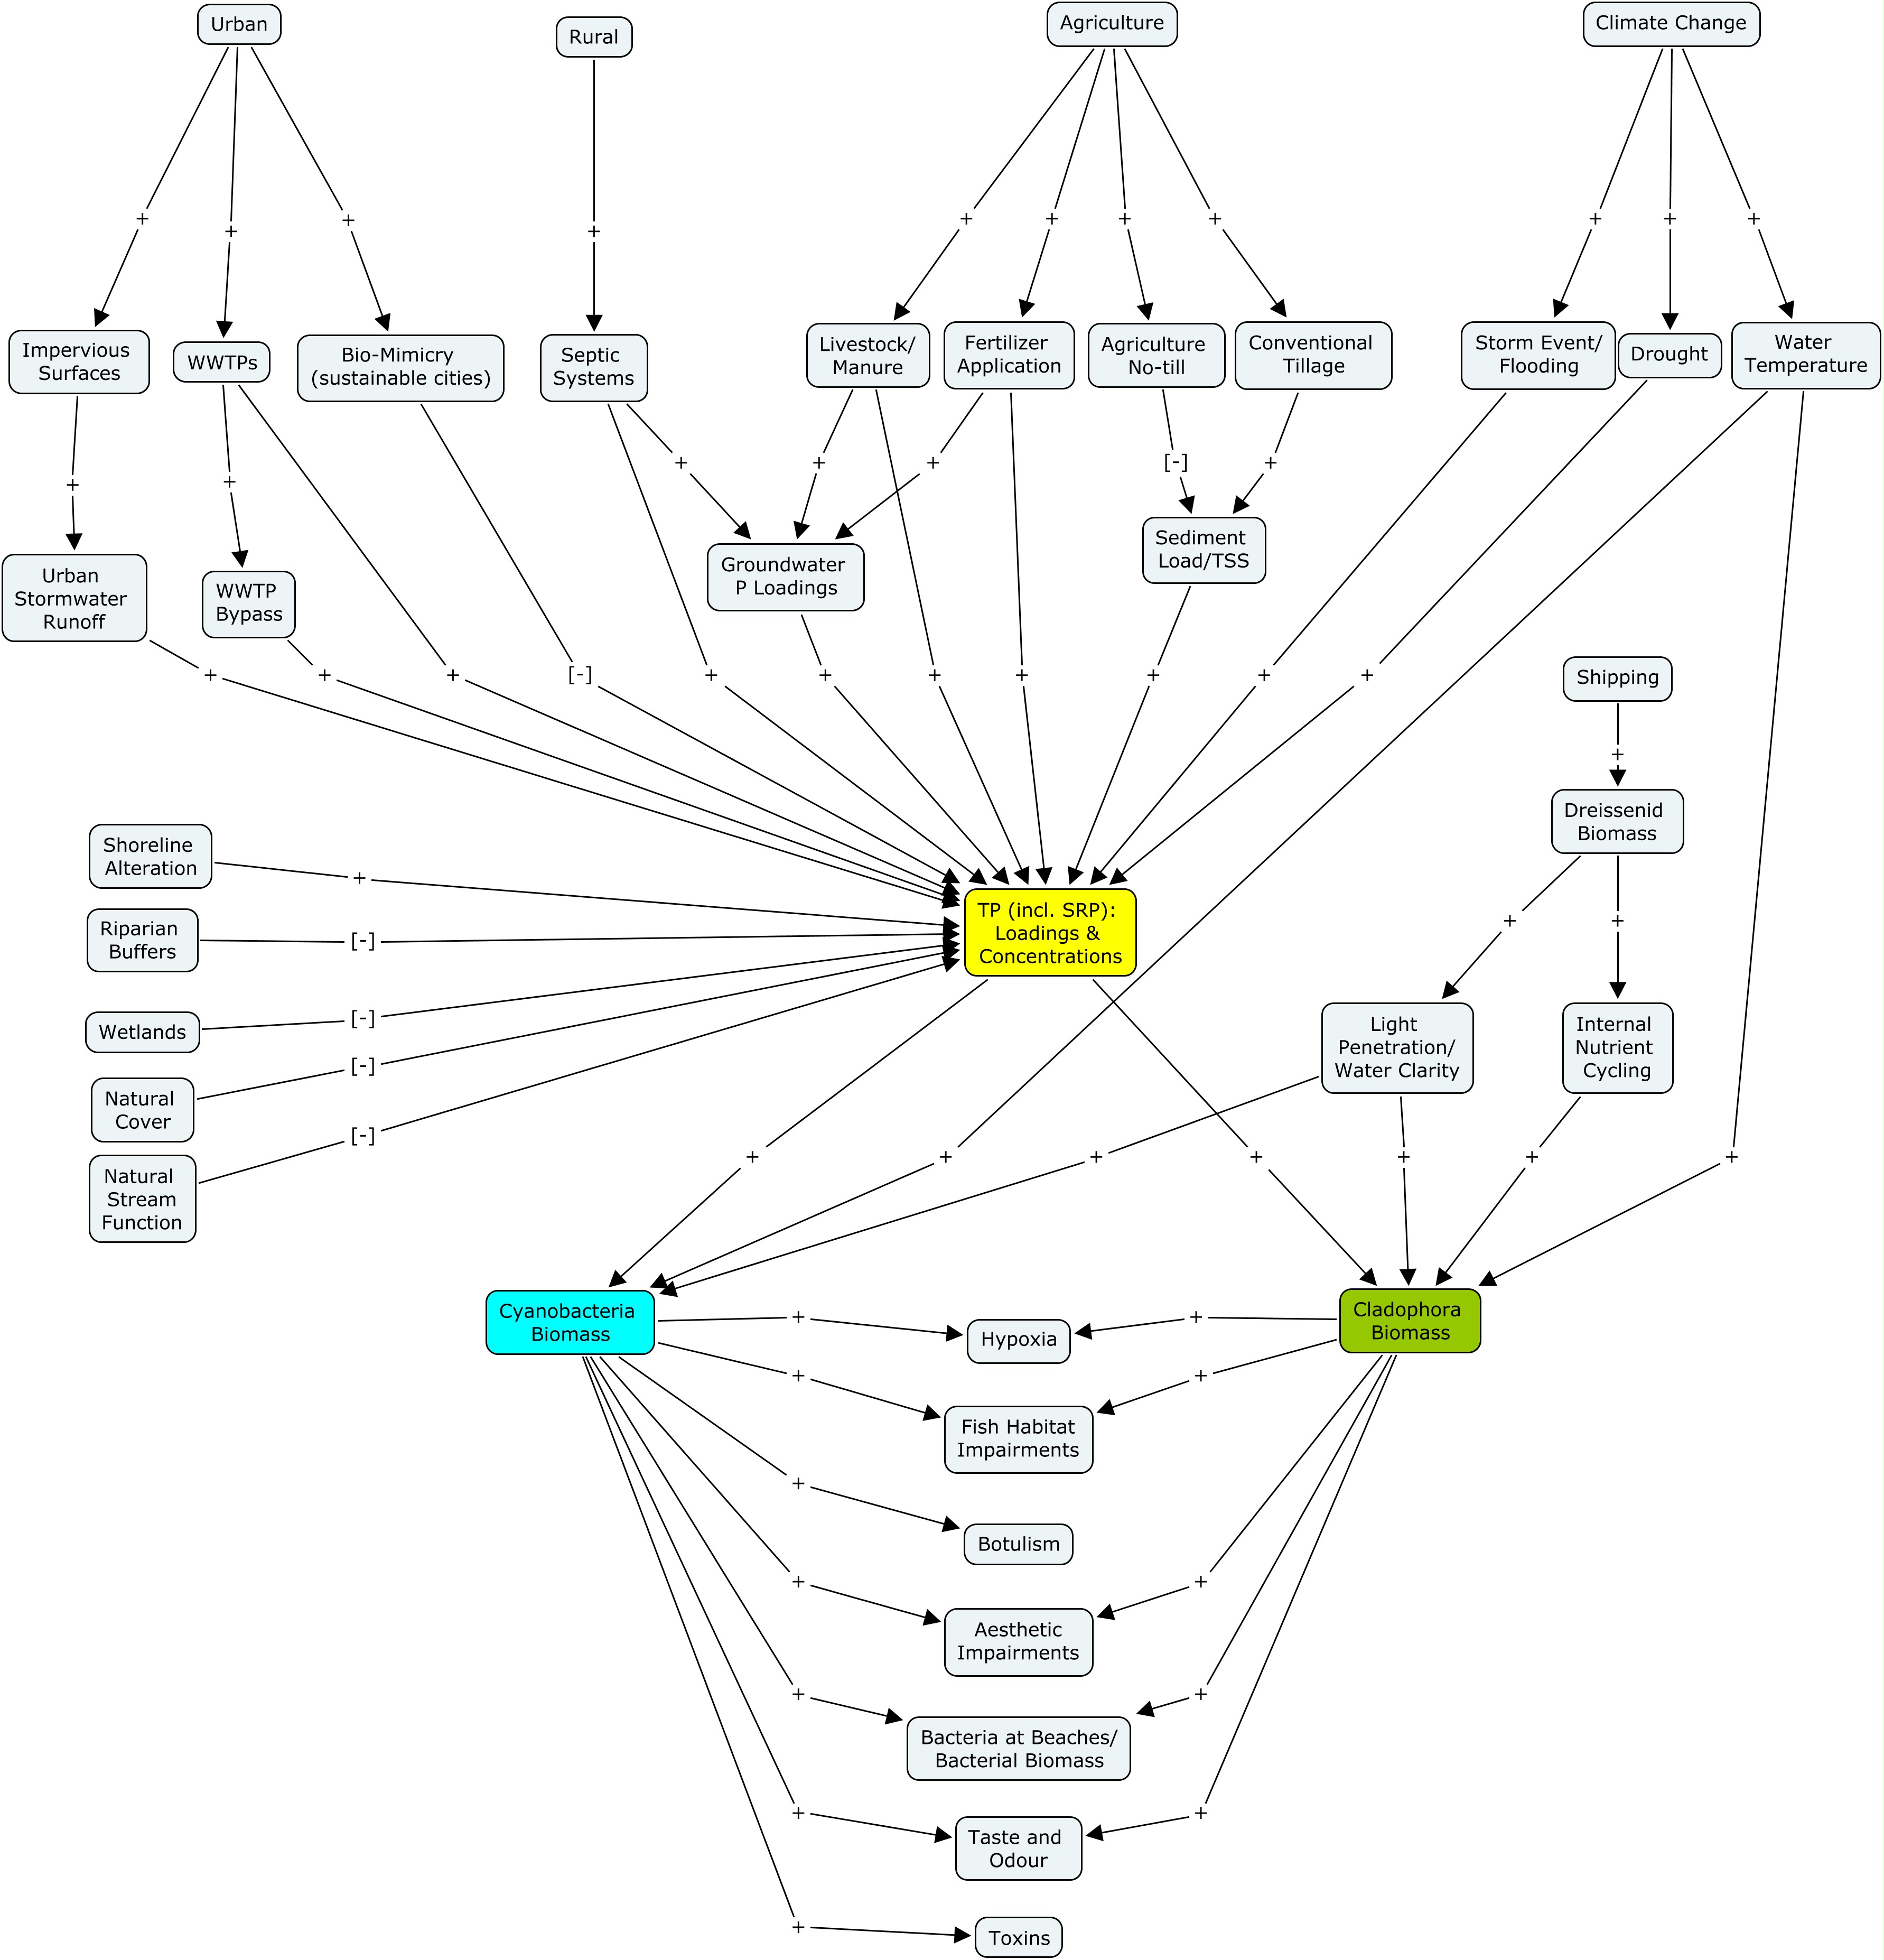
Recent manifestations of eutrophication in Lake Erie have become increasingly prevalent, despite evidence that total phosphorus loadings are at or near target levels that previously were deemed adequate to prevent appearance of nuisance algae, hazardous algal blooms and other manifestations. Findings of various task groups and symposia suggest that changes in the form rather than just the quantity of phosphorus may be responsible. Postulated sources include changing agricultural practices, increasing discharge from urban centres, and/or transformations or altered cycling by in-lake processes: http://web2.uwindsor.ca/lemn/ResearchNeedsWorkshop42.htm In February 2009, the Water Quality Board of the IJC and LEMN convened a workshop to assess the weight of evidence supporting each hypothesis www.ijc.org/en/priorities/2009/reports/2009-eutrophication.pdf Possible causes and ultimate endpoints were summarized by participants in a series of flow charts (fuzzy cognitive maps (FCMs) designed to graphically represent understanding and uncertainties about the processes. Both urban-related functions and agricultural activities may be significant external drivers of the reappearance of eutrophication, and likely play an especially important in the Lake Erie ecosystem. In March 2010, we convened a workshop to improve the resolution of postulated relationships between agricultural activities and eutrophication: .http://web2.uwindsor.ca/lemn/March2010AgFCMWorkshop4.4.htm Practices related to agriculture are possibly more amenable to 'no regrets' management actions than other postulated causes of the eutrophication issue. Goal of
Workshop * A complementary workshop - (LEMN 4.5C) is planned for summer 2014 in Ohio. Dates and location are being finalized
|
||||||||||||||||||||||||||||||||||||||||
|
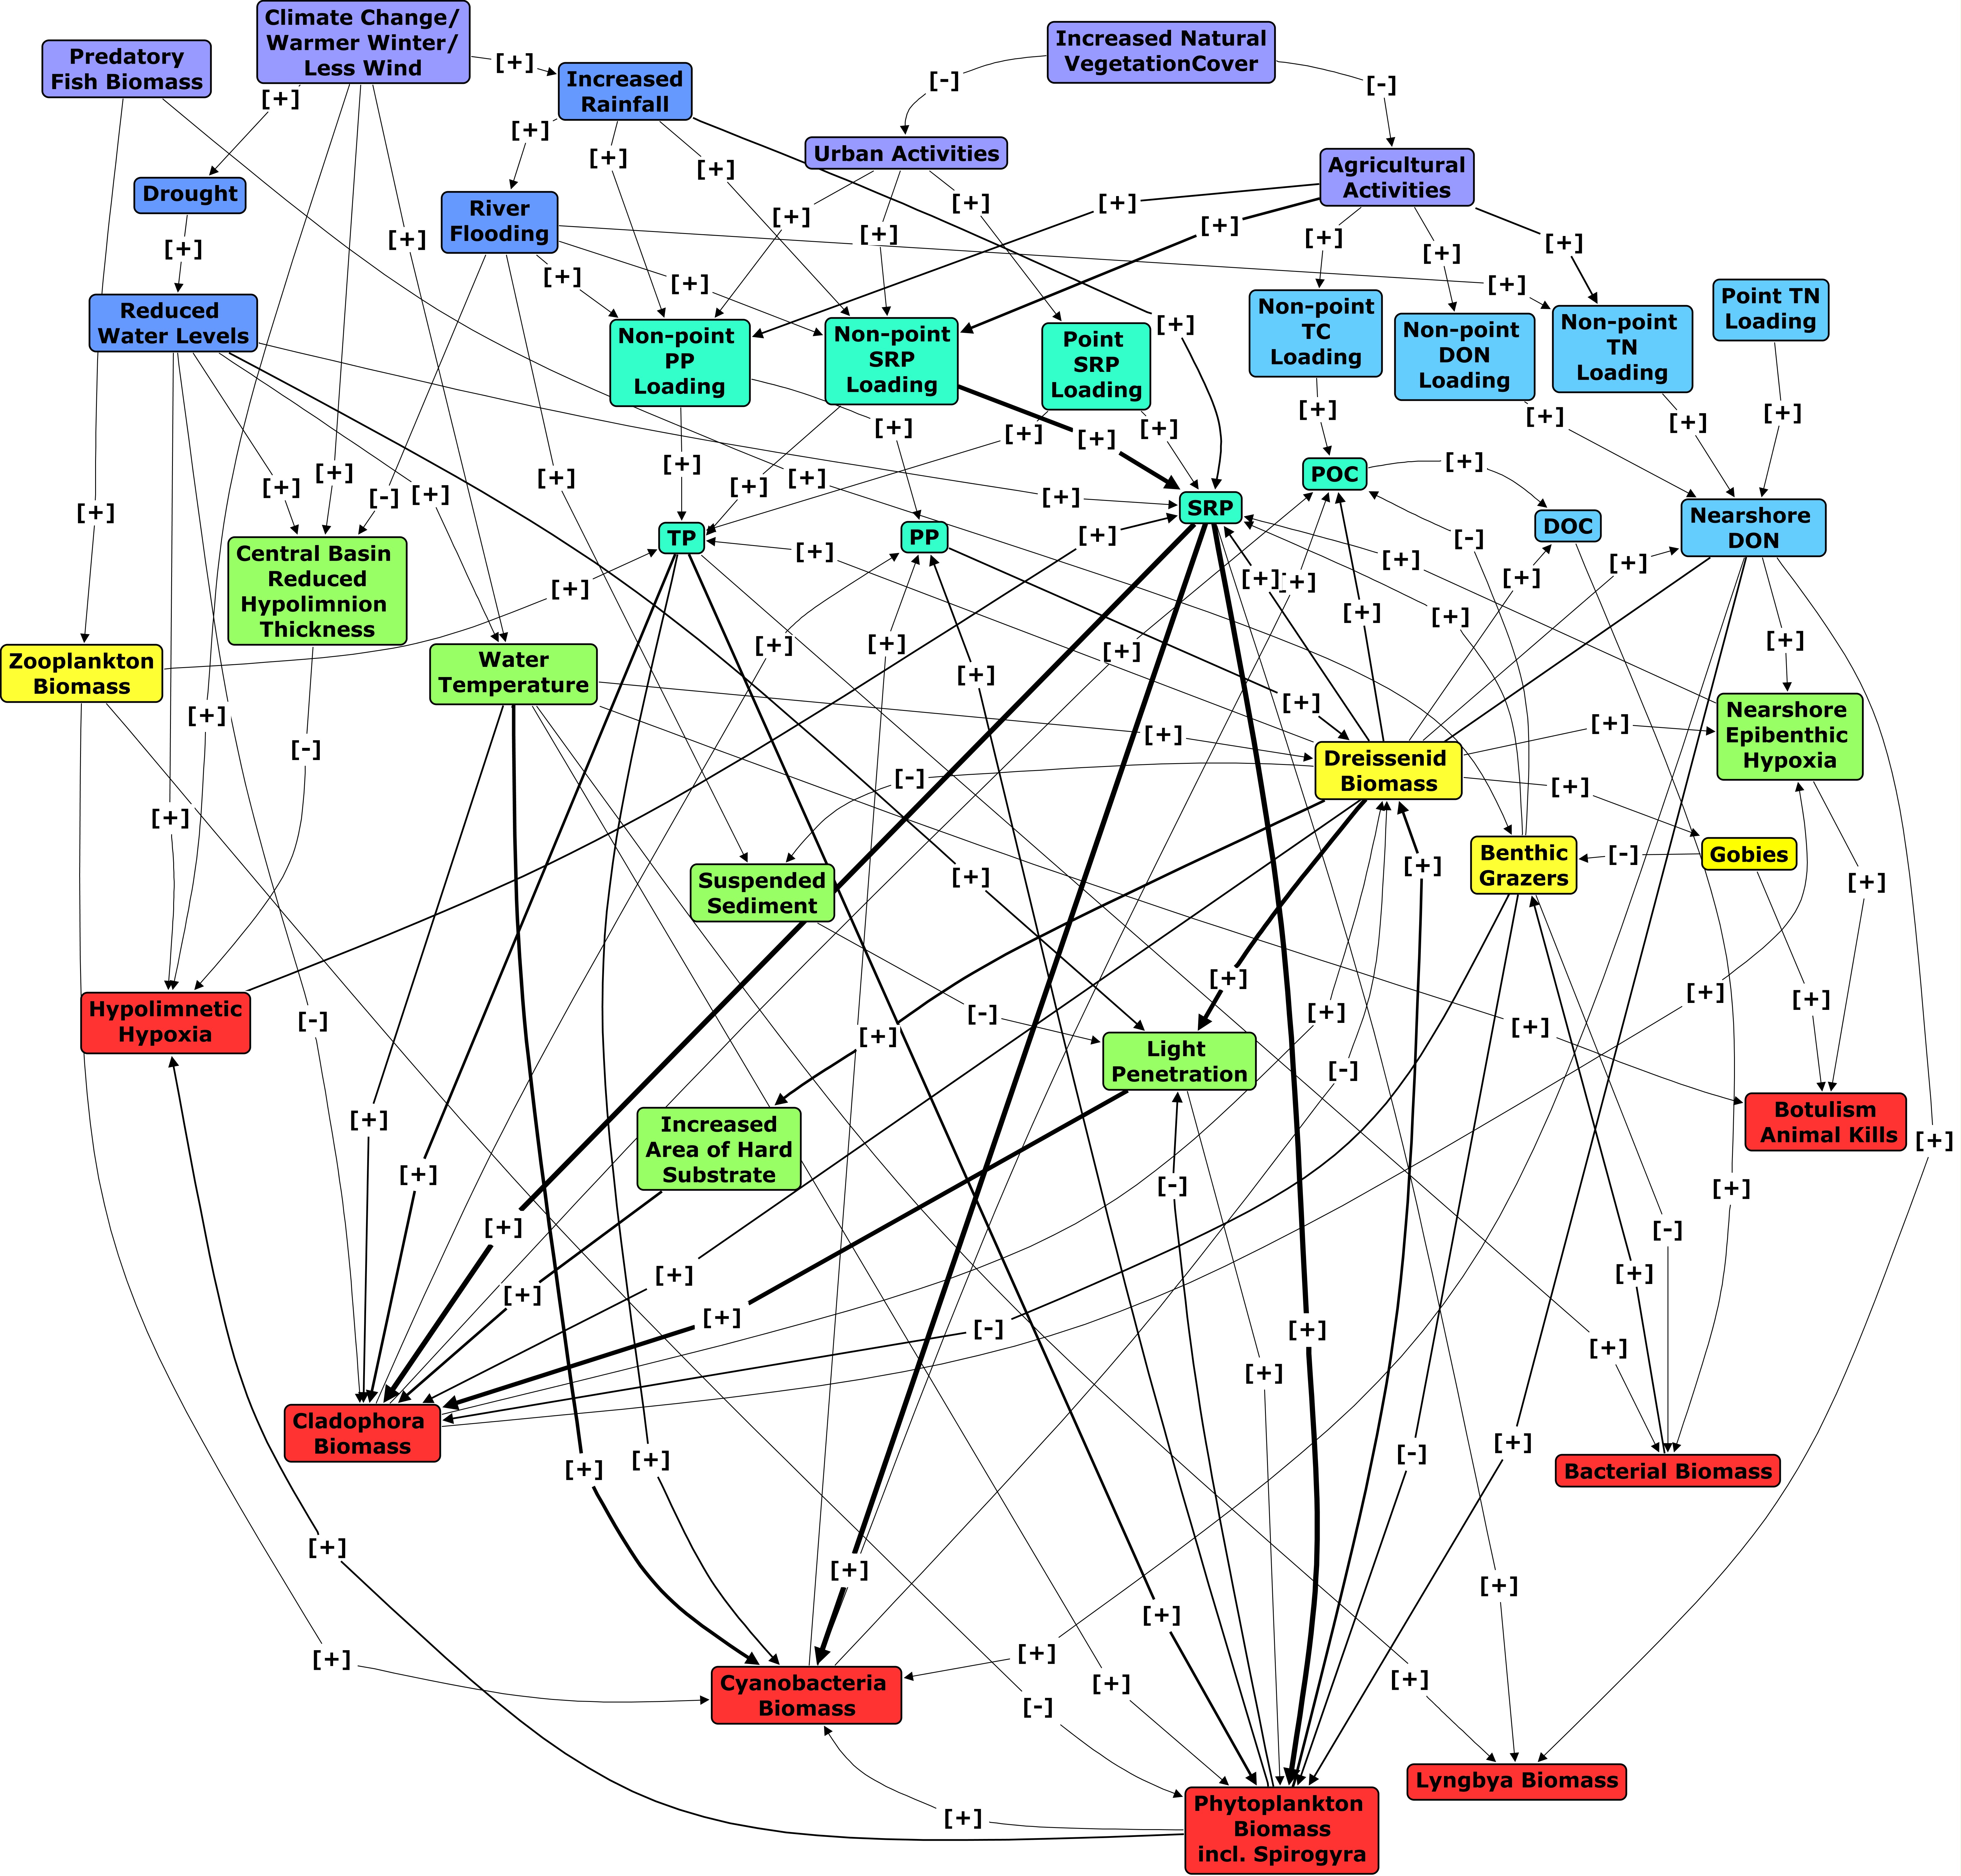
Background on Fuzzy Cognitive Maps (FCM) Fuzzy cognitive maps (FCMs) are a way of representing - among other things - the causal structure of a system. The maps consist of two sorts of elements: “concepts” (boxes) and “relationships” (directed arrows that link two or more concepts). The benefit of having multiple individuals prepare their own FCMs is that one gains from the variety of backgrounds and perspectives of participants. A consensus FCM, derived by amalgamating the individual FCMs, is ultimately a useful tool in representing the causal structure of the re-eutrophication problem in the Great Lakes, and can help to inform management decisions. Workshop activities Before the workshop. Based on a review of recent literature and presentations focusing on urban centres and nutrient effects in the Great Lakes, workshop organizers have compiled a list of key terms that summarize the possible causes, pathways and endpoints of development-related nutrient contribution to Lake Erie. This list will be distributed to conference participants before the workshop. Activity 1. Working from the list of terms provided by the workshop organizers, participants will select a subset of key terms they believe will be necessary to develop their own FCM (these terms will become FCM “concepts”). New terms can be added to the list. However, these will be discussed with the group before being integrated into the final consensus FCM. Developing individual lists of key terms is best done before the workshop day to avoid any influence of participants on one other. However, participants can also work to develop this list during the time allotted for Activity 2. Activity 2. Participants will draw individual FCMs based on their personal lists of key terms. This will be done using pencil and paper, so that participants can easily reconfigure and alter their FCM to their satisfaction. Participants will draw arrows representing the cause-effect relationships between pairs of variables. Participants will also assign values to each relationship, summarizing direction of the relationship, its strength, evidence base, spatial scale, temporal scale, universality, and the feasibility of implementing change (see Table 1). Activity 3. Once all participants have completed their individual FCMs, we will work as a group to integrate information from all maps into a single consensus map, as time permits during the workshop and in follow-up calls to participants. The consensus map will be developed through group discussion and through the integration of map variables and relationships. At the end of the exercise, we will have a single, consensual fuzzy cognitive map depicting the role of urban impacts in driving re-eutrophication.
FCM Definitions and Terminology Fuzzy Cognitive/Conceptual Map (FCM): A
tool for schematically representing causal relationships within a
system. A qualitative model of how a given system operates.
See example Table 1. Arc attributes, rank, description and potential attribute values/scores.
Fuzzy Cognitive Map: Example (Note: this is a very simplified example!) Problem: What are the causes and effects of climate change? Step 1: Choose a subset of the most important variables from a larger list of key terms
Step 2: Draw a fuzzy cognitive map based on personal best professional judgement
Next step: Compare and discuss this map with other participants Final step: Develop consensus map
Date:
Friday, April 25 Provisional Agenda Location: Upper Thames
River Conservation Authority, For more information please contact
Jesse Gardner Costa Organizing Committee:
Brad Bass,
Environment Canada
Note: Dates are subject to change, confirmation pending
|
||||||||||||||||||||||||||||||||||||||||
|
|
||||||||||||||||||||||||||||||||||||||||
|
(NOT for public distribution, thank you) IJC: Best Management Practices Review (2013)
FCM to define management objectives for complex ecosystems
(Hobbs 2002)
IJC
Workshop FCM
|
||||||||||||||||||||||||||||||||||||||||
| Back to Top |